The All-Important Lotto Balanced Game®
You are more likely to win at lotto if the sum of the set of lotto numbers you play falls within the 70 Percent Most Probable Range of Sums®. Lottery numbers are randomly drawn. If you want to play lotto to win, it's important to select your lotto numbers and place them on your play slips in patterns that are most similar to the way lotto numbers are actually drawn. The natural tendency of novice lottery players is to bet the lower numbers, especially the calendar numbers of 1 to 31, because of the heavy play given to birth dates, anniversary dates and children's ages.
If you study a list of past winning numbers for your state's lotto game, you'll see that randomly drawn numbers tend to be more or less evenly distributed over the entire number field. When you add up the six winning numbers in your state's lotto game, you get a sum. Add up the six winning numbers for several of the drawings and you will find that most of the winning combinations tend to fall within the same range of sums.
A typical lotto 6/49 drawing could add up to 150: 3 + 17 + 23 + 24 + 36 + 47 = 150
The lotto 649 winning numbers can have sums that range from as low as 21 to as high as 279 in the game.
In a 49-number field, there is only one six-number combination that adds up to 21:
And, in the 6/49 lotto game, only one six-number combination adds up to 279:
Those two combinations have the smallest and largest possible sums. And they occur only once - at the tail ends of a bell curve, making it virtually impossible for either of those groups of numbers to be drawn as a winning combination.
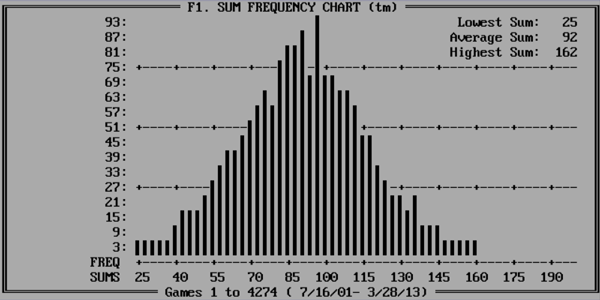
In the 49-number pick-6 lotto 649 game, the most frequently occurring sum is 150, which is the Midpoint Sum.
The sums of lotto combinations can be compared to the sums of combinations on a pair of dice. On either end of the Bell Curve, there is only one way to make a 12 (boxcars, 6 and 6), and there is only one way to make a 2 (snake eyes, 1 and 1). But there are SIX ways to make a 7 (the top center point of a Bell Curve for a pair of dice). They are 6 and 1, 1 and 6, 5 and 2, 2 and 5, 4 and 3, 3 and 4. So, of course, it is much easier to throw a 7 in dice than any other number because there are more ways of getting the sum of 7.

The above photo shows an example of a lotto game's sum frequency chart. You can use Advantage Gold to create this chart for your game. You will see that every lotto game follows a similar bell curve.
Gail Howard discovered that more than 70 percent of the past sets of winning numbers are produced by only 27 or 28 percent of all the possible sums.
In a 6/49 lotto game, 27.4 percent of the sums fall within the Sum Range of 115 to 185 yet account for 71.32 percent of the jackpot winning combinations! This means that if you play a six-number combination with a sum that falls either above or below the 115 to 185 range, you can expect that the numbers with the sum you selected will fail to show up, giving you no chance to win, 71 percent of the time.
A Balanced Game® is a Combination that Falls within the Most Probable Range of Sums®
If you want to give your odds more leverage, that is, play with the probabilities more in your favor, use my "70 Percent Rule" and see to it that the sums of your lotto bets fall within the Most Probable Range for the lotto game you play.
Because the vast majority of lotto players still bet the lower (calendar) numbers (birth dates and anniversaries), I strongly recommend that you play the higher end of the Most Probable Range from the Midpoint Number up. For example, in the 6/49 lotto game, the sums at the higher end of the Most Probable Range are between 150 and 185. If your numbers do win, the prize pay outs will be higher because fewer winners will be sharing the prize pool.
The range of sums varies with the number field of the lotto game. For example, the 70 percent Most Probable Range of Sums® for the popular Fantasy 5 5/39 game is 75 to 125.
The 70 percent Most Probable Range of Sums® for all pick-4, pick-5, pick-6 and pick-7 lotto games are listed here. Find and use the Most Probable Range of Sums for the game YOU play.
History of the Balanced Game®
.
In 1983, Gail Howard was shocked to discover that some 10,000 tickets with the number combination 1-2-3-4-5-6 were bought each drawing in the New York Lotto game. This lottery ticket is doomed to lose because the number selection is too far out of balance to ever come up in a random drawing. To convince her readers not to bet this, or other unlikely combinations, but to play the combinations that are more likely to be drawn as winners, Gail Howard invented the Balanced Game®.
In 1983, Gail added up each of the six winning lotto number combinations all the way back to the beginning of the first New York 6/40 Lotto game in 1978. Then Gail calculated the range of sums for various lotto games and published her Balanced Game® method in several newspapers and national magazines, including Gambling Times magazine, of which she was Lottery Editor. The Balanced Game® appeared in all the editions of her books since her 1985 hot selling Special Report, State Lotteries: How to Get In It and How to Win It (no longer in print). Gail's intention was to show her lotto readers that to have a better chance of winning, the sums of six favorite lotto numbers should fall within a certain range of sums (the Most Probable Range of Sums) most similar to the sums of actual drawing results.
Also see: what is lottery wheeling and why lottery Balanced Wheels® produce so many jackpot winners.
- ORDER (M-F 8am-5pm EST): 1-727-441-8906
- TECH SUPPORT (M-F 1pm-5pm EST): 1-727-441-8714


 CART
CART