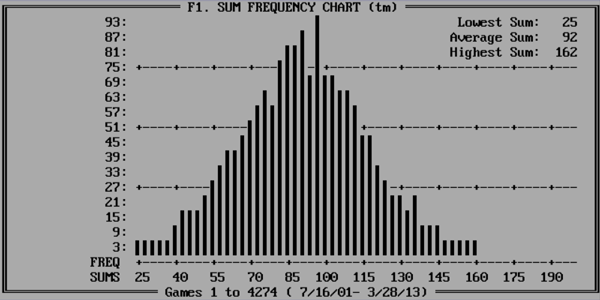
The Sum Frequency Chart is a lotto strategy chart in Advantage Gold lottery software
and the Lottery Master Guide book. The chart shows the number of times that each sum
of winning lotto combinations occured within a game.

The above photo shows an example of a lotto game's sum frequency graph. You can use Advantage Gold to create this chart for your game. You will see that every lotto game follows a similar bell curve.

The above photo shows an example of a lotto game's sum frequency graph. You can use Advantage Gold to create this chart for your game. You will see that every lotto game follows a similar bell curve.
